Victoria
Getting a clear picture of your finances is not an easy task. At IHF we have designed an easy to use tool utilizing Microsoft ® Excel that incorporates all the fundamental methods IHF recommends. Below is an overview of the tool and it's capabilities along with some screen shots. Be sure to download a demo of the tool to get a good feel for it's ease of use and functionality!
Let's take a look at the following:
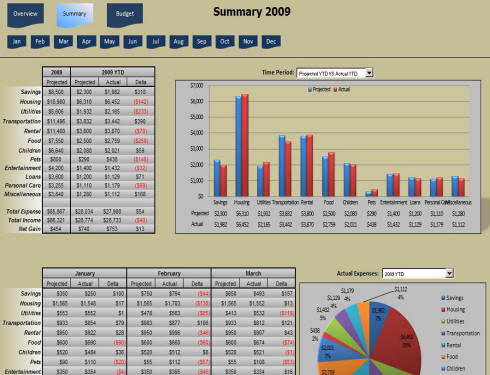
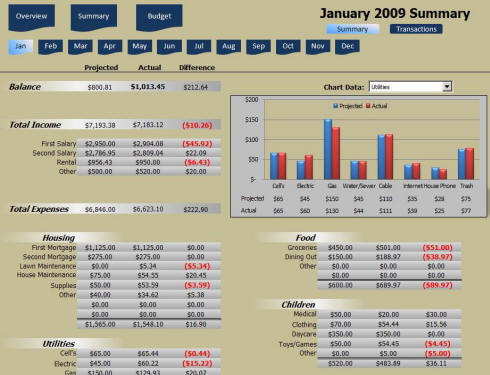
This screen shot shows the Yearly Summary Page. This screen shows the user in one spot how they are doing against their budget for the year. It also breaks down and compares budget vs. actuals for individual months. Dynamic charts provide you a visual representation of this data and the ability to quickly change from one data set to another with just the click of a mouse. Each Chart also has the tabular data listed so you can see exact numbers. The dynamic pie charts allow the user an easy way to see where the majority of their money is being allocated.
 The
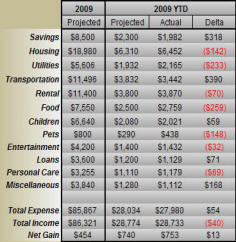
table to the left is a close up of the one on the overview screen
above. Each budget category, which is customizable by the
user, has listed the projected spending for the entire year as well
as for the "Year-to-Date". It also has the "Delta" calculated
to let you know if you are ahead or behind where you projected
yourself to be. The same data is also available for the
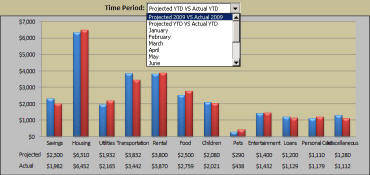
individual months. The dynamic graphs let you easily switch
between all the different data sets in one spot.
The
table to the left is a close up of the one on the overview screen
above. Each budget category, which is customizable by the
user, has listed the projected spending for the entire year as well
as for the "Year-to-Date". It also has the "Delta" calculated
to let you know if you are ahead or behind where you projected
yourself to be. The same data is also available for the
individual months. The dynamic graphs let you easily switch
between all the different data sets in one spot.
The budget categories that you see listed are all customizable by the user. Not everyone's
situation or lifestyle is the same, so it is important for the user to be able to define how
they want to categorize their expenses. The data shown in the "Projected" columns is all
automatically populated from what the user has entered into their Budget Sheet (shown below).
The data in the "Actual" column is all automatically populated from the user's input of
actual expenses (also shown below). Nothing on this page needs to be maintained by the
user! It is a summary page that is extracting data from other areas and displaying it in
an easy to use manner.
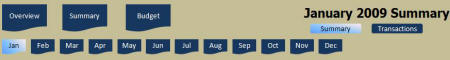
The above picture shows the easy to use Navigation Bar that is present at the top of every page. With a click of the mouse, you can easily move from monthly data, to your budget page, and then to the summary page. Let's look at the monthly view next!
The monthly view follows the same format as the yearly view but with more detailed information for the specific month. Again, you can see your projected balances, actual balances, and the Delta for each category plus each sub-category (as defined by the user!). Another dynamic chart (as seen below) is available for the user to easily switch between each category and see the specific balances for sub-category. This page is essential to be able to review how you did in past months compared to budget at a detailed level. Also, it gives you the ability to assess in the current month how much money you have left to spend to stay under budget! Having this clear picture of where you are against budget provides people the ability to make smart choices around what to buy!
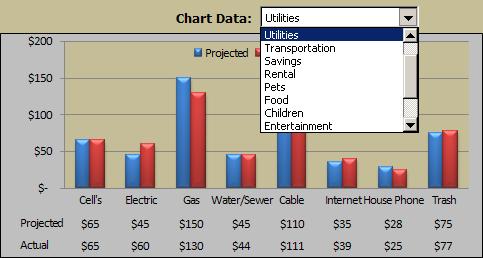
Again, no information on the monthly summary page needs to be maintained by the user! All the projected data and categories are extracted from the users budget page and the actual numbers are calculated from the transactional page.
![]()
This is the page where the user enters in all their transactional data for the month. This page is easy to maintain if you just download your transaction data from your banks website and paste the data into this page. Once you do that, you just need to select the appropriate category that the line item belongs to using the drop down menu on the left. The categories that are available in the selection list will be those that were defined by you on the budget page. Automatic filters are available at the top of the columns to allow the user to display only certain information. For instance, does your summary page show you spent way more on entertainment than you budgeted for? The automatic filter, as shown below, will allow you to display only those transactions labeled as entertainment so you can easily assess where your spending occurred.
![]()
Finally, lets look at the Budget page! This is where the rubber meets the road. This is the page where users will set up their categories and sub-categories that will be viewed on all other pages. This is also where the projected spendings will be determined for each sub-category. This is also where you will find the true power of our tool with the Projected Account Balances.
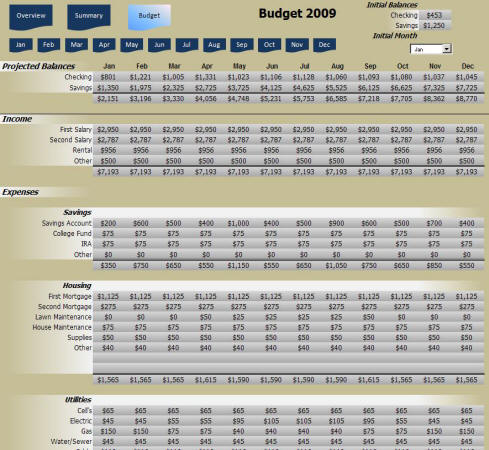
Pretty much every thing on this page, except the Projected Balances, is editable by the user.
The user can enter in the names for categories and sub-categories, and then put fill in their
budget for each one on a monthly basis. The tool will also project balances for 1 savings and
1 checking account. The checking account is always the primary account, but any transactions
from checking into the "Savings Account" sub-category will show up in your
Savings projection.
This is where you can really start to plan for the future! If you know you are going on vacation
in October, you can put in your projected spending and then see how that effects your balance.
Don't have enough? Well you may need to cut back on other spending or pull money out of savings.
This tool gives you the flexibility to play with many options to see what is the best way to
approach the situation.
The other powerful feature of the Projected Balances is that they
are completed integrated with your actual spending. It doesn't
do you any good to know what your projected balance 6 months out is
if you have not been following your budget. After each month,
the projected balances will be updated to account for your actual
spending in the previous month. If you come in under budget
for the month, you will see that reflected in higher projected
balances. If you come in over budget, your projected balances
will be lower. It is good practice to look act your projected
balances after each month and make appropriate "tweaks" to your plan
to keep you on track!